Stories, not feature lists
Each story below describes the real product against real data — screenshots are being added as we film them.
Formulas
You type =ES.Get("PET.RWTC.D") and WTI prices spill into the
sheet. Tables with continuous calendars and Bloomberg-style forward fill:
=ES.Table(...). Search by words, not codes:
=ES.Search("henry hub"). No SQL anywhere, ever.
screenshot: formula spilling series data
Your laptop
Point Sparrow at file:C:\datasets — a folder of dataset
files. Everything works with no network at all. Reading a single series
from a 28-million-row file takes 8 milliseconds.
screenshot: Stats group showing "8 ms fetch"
Your team
Move the folder to a NAS share. Read-only, no server, no IT ticket —
and every analyst on the team gets the same live datasets. Only the files
each analyst uses get copied to their machine, automatically.
screenshot: Source line showing file:\\NAS\energy
Published datasets
Point at https://publisher.example/energy — the same folder
behind any static web host or CDN. Files download on demand and cache
locally; freshness checks are a single HTTP header. An S3 bucket works the
same way: s3://market-data.
screenshot: Connect URL dialog
Live
When you need live pushes, authentication and a server-side analytics
engine, point the same workbook at an Arrow Flight server. Nothing else
changes — that's the point.
screenshot: same sheet, Source: flight://server
Freshness — the amber ribbon
Sparrow checks your sources every 30 seconds and once on workbook open.
New data turns the ribbon amber and names the file in the status bar.
Per-column =ES.NewData() cells flip TRUE on exactly the series
that moved. It works even when the source is a passive folder — because
publishers follow one honest rule: a file's timestamp moves only when its
data changed.
screenshot: amber NEW DATA warning + one TRUE column
Revisions — the comments
Refresh doesn't repaint your sheet. It marks precisely the new values
(green borders) and the revised ones — with a comment showing
Before and Now. Real data gets revised. Your spreadsheet
should admit it.
screenshot: revised cell with Before/Now comment
Offline analytics
Descriptive statistics, transforms, correlations, spreads, crack
spreads, rolling volatility, seasonality context, outliers — computed
inside the add-in, straight from your files. Turn the Wi-Fi off; your
analysis keeps working.
screenshot: =ES.Stats() with Wi-Fi off
One-click worksheets — pages as recipes
The New Sheet menu builds complete analyst pages in one click:
parameter cells with dropdowns, change tracking, series with hover
documentation, even reserved "your work" columns that refreshes never
touch. Each page design is a plain JSON recipe that ships beside the
add-in — design a page once and every analyst gets it; a new design is
a file, not a release.
The catalog in a formula
=ES.Catalog("PET.WDIST*") spills a reference table of
everything available — IDs, names, units, frequency, and the true last
data date, straight from the folder's own catalog. Wildcards, honest
row caps, and it works offline. Spot a series, type its ID into a
table's header row, and it's a charted column ten seconds later.
screenshot: catalog page with pattern cell
The self-building table
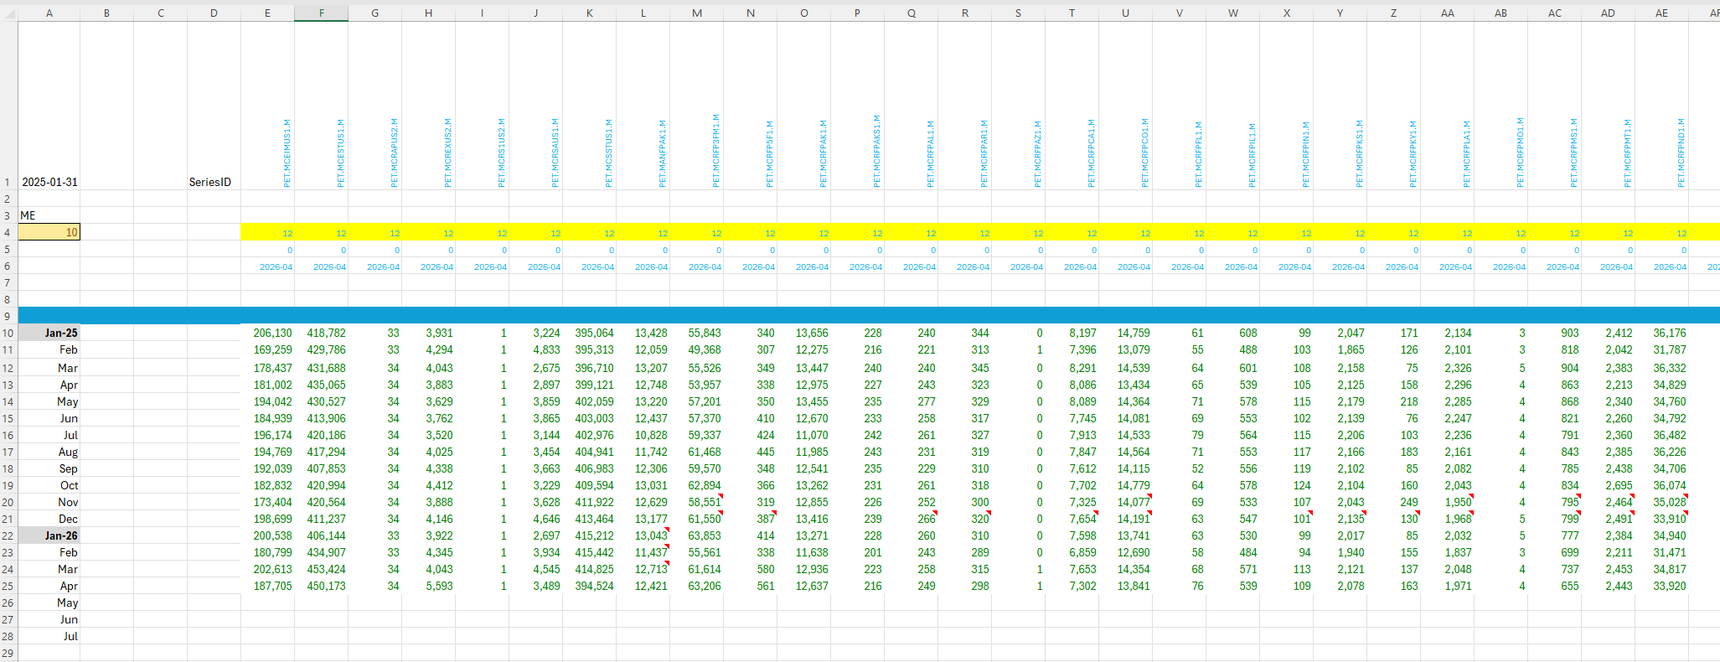
=ES.Table(1:1, …) turns row 1 into a live series list:
type an ID, a labelled dated column appears near-instantly. Gaps become
aligned spacer slots that fill when you type into them. With
=ES.Name(1:1) and =ES.Units(1:1) underneath,
a self-labelling dashboard is four formulas and a row you type into.
screenshot / clip: typing IDs, columns appearing
Get early access